So profit-and-loss reports/balance sheets measure the financial health of your business. And you’re probably already measuring these via your accounting system, the “back end” of your business.
If you’re a numbers guy like me, you love quantifiable data… I’ve been known to spend Sundays reconciling my credit card bill…don’t judge.
But what about the other half? What about the “front end” of your business?
How does one measure the health of sales and marketing efforts?
Because there’s the old saying, “I know that half the money I spend on advertising is wasted; the trouble is I don’t know which half.”
And this confusion is common. Often marketing campaigns will crossover with existing advertising strategies so it can be difficult to glean any real business intelligence. Often, with new clients, I’ll find a list of Excel sheets with a multitude of columns for lead names crossed with colours that signify lead sources looking like a rainbow soup of spreadsheet data.
If this is you, there is an easier way.
You can easily track and measure your lead source data with a Customer Relationship Management (CRM) solution. Once all contacts (leads, qualified prospects and clients alike) are unified into one database and activity management solution, your reporting becomes a lot easier.
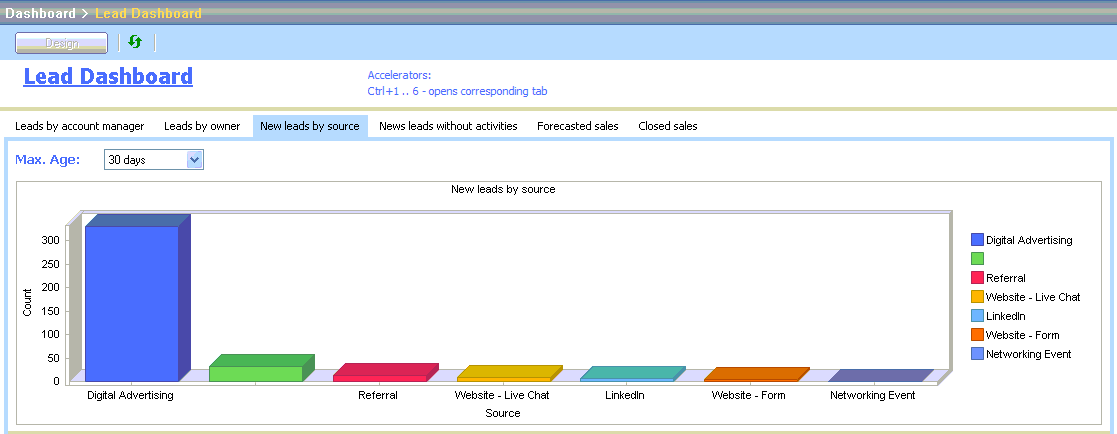
Below is a pivot chart from GoldMine CRM. You’ll notice that we’re looking at the leads generated in the last 30 days, displayed by source. It’s one of the many “out of the box” dashboards that come with initial install of the product. Whatever CRM your organisation uses, this is an easy way to track your lead sources and to ensure that you continue to receive an effective ROI from your marketing efforts.
Here are 3 steps to making this chart work for you:
- Build a company culture in your sales teams to always ask new prospects, “how did you hear about us”?
- Train staff to update this answer in the source field of your CRM. If you’ve bulk purchased a list and are importing to the database, be sure to include this field as well.
- Ensure data accuracy. This can be done a number of ways as every system is different:
- Set field security to “mandatory updates” on this field – i.e. this field cannot be blank when creating a new contact record.
- Create a lookup selection list so users can easily choose from the most common sources. Be sure to include an “Other” where they don’t apply. If you find too many “Others”, you can find out why.
- Set the data entry conditions on this field so users may only enter data that is from the list
- If the source field is filled with junk, do a global replace of field data to clean it up.
Segway story:
We have a client in the wholesale trade business. They needed to track referrals and initially used the source field to add the names of existing clients who gave referrals and then offer a spotters fee. The problem was that the source field became difficult to report on because there were referral names, e.g. “John Smith” and “Jane Doe” all over the place – a challenge to group and view any business trends.
After discussion, we simply added the source of “Referral”. And used the referral tab in GoldMine to track these by name. We then built a custom dashboard combining the referral and commission rates and saved them hours a week in manual reporting.
Finally, once you get to this meaningful chart, ensure you review the data regularly to correct exceptions and ensure data accuracy.
Hope this helps you towards building a business where you can manage by reports. For more, please contact us at 1300 3CUBED.